Hyperliquid Open Interest Explained: What It Means and How to Read It
Hyperliquid open interest measures outstanding perpetual exposure in a market. It shows how much positioning remains open, but not whether traders are collectively bullish or bearish.
Direct answer
What is open interest on Hyperliquid?
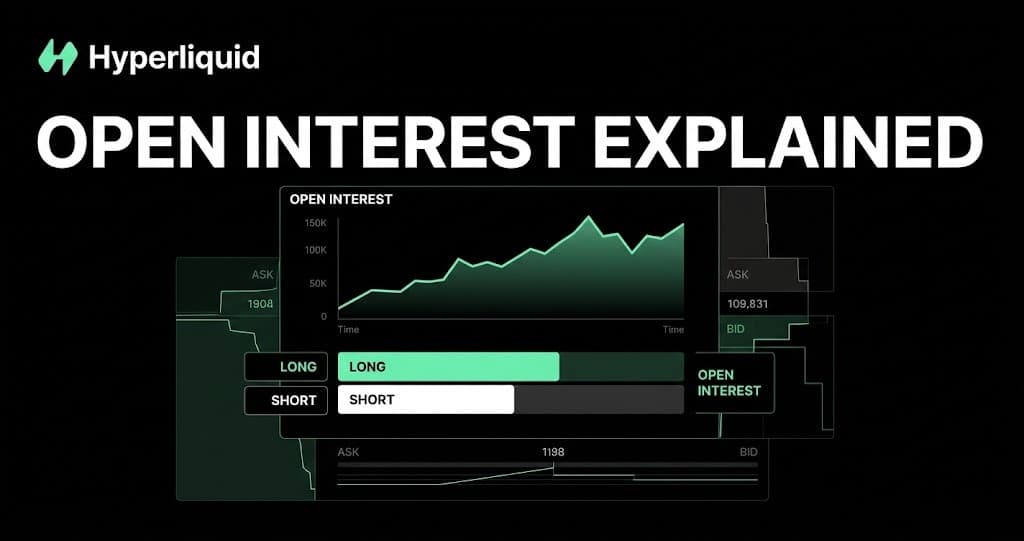
Open interest on Hyperliquid is the outstanding size of positions in a perpetual market that have not been closed. Each matched position has a long and a short, but open interest counts the contract once rather than adding both sides together. Rising OI means more exposure is being opened; falling OI means exposure is being closed.
Updated 27 Aug 2026
On this page
- How does open interest work on Hyperliquid?
- What is the difference between open interest and volume?
- Where can you find Hyperliquid open interest?
- How should you read open interest with price?
- What do open interest and funding rates show together?
- How do liquidations affect open interest?
- What happens when a Hyperliquid market reaches its open-interest cap?
- What should you check before using OI in a trade?
- Which open-interest mistakes should you avoid?
Open interest, usually shortened to OI, is a snapshot of active exposure in a derivatives market. It increases when a trade creates new positions and decreases when existing positions are closed. A trade can also change volume without changing OI, which is why the two figures answer different questions.
On Hyperliquid, open interest is available for each perpetual market alongside data such as mark price, oracle price, funding and daily notional volume. It is useful context for judging participation and crowding, but it is not a standalone trading signal.
How does open interest work on Hyperliquid?
Every perpetual position needs two sides: one trader is long and another is short. If both sides open new exposure, OI rises by the matched amount. If both sides close exposure, OI falls. If an entering trader takes over the exposure of a trader who is leaving, the total can stay unchanged even though a trade occurred.
| What the long does | What the short does | Typical OI effect |
|---|---|---|
| Opens a new position | Opens a new position | Increases |
| Closes an existing position | Closes an existing position | Decreases |
| Opens a new position | Closes an existing position | Usually unchanged |
| Closes an existing position | Opens a new position | Usually unchanged |
What is the difference between open interest and volume?
Volume counts trading activity during a period. Open interest counts exposure that remains open at a point in time. The same position can generate volume when it opens, again if it changes hands and again when it closes, while OI only reflects whether outstanding exposure was created, transferred or removed.
| Metric | What it measures | What a high reading can suggest |
|---|---|---|
| Open interest | Positions still outstanding | More capital exposure, participation or crowding |
| Volume | Trades completed during a selected period | More turnover and short-term activity |
| Order-book depth | Resting liquidity near the current price | Potentially better execution for a given order size |
Do not use OI as a substitute for liquidity. A market can have substantial outstanding positions and still develop a thin order book, wide spread or heavy slippage. Before placing a large order, inspect the bids, asks and expected execution rather than assuming that high OI guarantees an easy exit.
Where can you find Hyperliquid open interest?
Traders can view current market statistics in Hyperliquid's interface. Developers and analysts can request perpetual asset contexts from the official Info endpoint with the metaAndAssetCtxs request type. The response returns market context fields including openInterest, markPx, oraclePx, funding and dayNtlVlm for each asset in the selected perpetual DEX.
The API's openInterest value is an asset-size figure rather than a ready-made universal dollar comparison. As a practical estimate, multiply open interest by the current mark price to express the exposure in notional terms. For example, 2,000 units of OI at a $25 mark price is approximately $50,000 of notional OI. The result changes with both position size and price, so keep the measurement method consistent when comparing dates or markets.
How should you read open interest with price?
The useful question is not simply whether OI is high. Ask whether it is rising or falling, how quickly it changed and what price did at the same time. The four common combinations below are starting points for investigation, not mechanical buy or sell rules.
| Price | Open interest | Possible reading | What to check next |
|---|---|---|---|
| Rising | Rising | New exposure is joining an upward move | Funding, spot demand and whether longs look crowded |
| Falling | Rising | New exposure is joining a downward move | Funding, sell pressure and whether shorts look crowded |
| Rising | Falling | Positions are closing during the rise | Whether short covering rather than new demand is driving price |
| Falling | Falling | Positions are closing during the decline | Whether long liquidations or voluntary exits are reducing OI |
Time frame matters. A small hourly change may be noise inside a much larger weekly build. Compare the current move with that market's own recent history rather than applying one fixed OI threshold to BTC, a smaller crypto perpetual and a newer HIP-3 market.
What do open interest and funding rates show together?
Open interest measures the amount of open exposure; funding reflects the payment between long and short positions that helps keep a perpetual near its oracle reference. Positive funding means longs pay shorts, while negative funding means shorts pay longs. Reading the two together can reveal whether growing exposure is also becoming expensive for one side to hold.
- Rising OI with strongly positive funding can indicate growing exposure while longs pay a larger recurring cost.
- Rising OI with strongly negative funding can indicate growing exposure while shorts pay the recurring cost.
- Falling OI after an extreme funding reading can mean crowded positions are being reduced, but it does not identify whether exits were voluntary or forced.
- Flat OI with changing funding can reflect a shift in perpetual pricing even when total outstanding exposure changes little.
How do liquidations affect open interest?
A liquidation attempts to reduce or close an undercollateralized position, so successful liquidation exits usually reduce OI when the opposing exposure also closes. During a rapid move, falling OI alongside liquidation data can therefore be consistent with leverage leaving the market. It is not conclusive on its own because traders can open fresh positions while others are being liquidated.
High OI can increase the amount of exposure vulnerable to a sharp price move, but it does not tell you where liquidation prices sit. The practical risk depends on leverage, entry prices, margin tiers, cross or isolated margin, account equity and order-book liquidity. Use OI as market-level context, then manage liquidation risk at the position and account level.
What happens when a Hyperliquid market reaches its open-interest cap?
Hyperliquid uses open-interest caps as a market-risk control, particularly where liquidity, basis or leverage could make additional exposure unsafe. When a market is at its cap, orders that would increase OI can be rejected. Traders can still use orders that reduce existing exposure, subject to the live market and order rules.
The official Info endpoint provides a perpsAtOpenInterestCap request for checking capped markets. Hyperliquid's documented order errors also distinguish cap-related rejections, including a position increase at the cap and an overly aggressive order while capped. An error at entry is therefore not necessarily a wallet, balance or API failure.
Builder-deployed HIP-3 markets have additional cap mechanics. Their documentation describes size caps per asset and notional caps both per asset and across the builder's DEX. A deployer can set a custom per-asset notional cap within protocol constraints, so do not assume that two HIP-3 markets have the same capacity.
What should you check before using OI in a trade?
A practical open-interest checklist
Confirm the unit
Check whether the chart shows base-asset size, dollar notional or a percentage change before comparing values.
Choose a consistent time frame
Measure OI and price over the same interval, then compare the move with that market's recent baseline.
Add funding and volume
Funding helps show which side pays; volume shows activity. Neither replaces open interest, and OI does not replace them.
Inspect executable liquidity
Check spread, depth and expected slippage. Outstanding exposure does not guarantee enough liquidity for your order.
Look for a cap or one-off event
A cap, liquidation wave, listing change or large price move can explain an unusual OI pattern better than a simple sentiment story.
Define risk without relying on OI
Set position size, margin mode and exits from your own loss limit. OI can support a decision but cannot control its downside.
Which open-interest mistakes should you avoid?
- Calling rising OI bullish without checking price, funding and spot-market context
- Treating OI as the number of longs minus the number of shorts
- Adding long and short exposure together and double-counting each contract
- Confusing high OI with deep order-book liquidity
- Comparing base-asset OI with dollar-notional OI as if they were the same unit
- Using a single screenshot instead of measuring the change over a defined period
- Assuming falling OI proves a liquidation event without supporting data
- Ignoring an open-interest cap when a position-increasing order is rejected
Frequently asked questions
Does rising open interest mean Hyperliquid price will go up?
No. Rising open interest means more perpetual exposure is outstanding. Price can rise or fall while OI increases, so direction must be assessed with price, funding, volume, spot demand and liquidity.
Is high open interest bullish or bearish?
Neither by itself. Every open perpetual contract has a long and a short. High OI can indicate strong participation or crowded leverage, but it does not reveal which side will be profitable.
What is the difference between Hyperliquid OI and volume?
Open interest measures positions that remain outstanding. Volume counts trades completed during a period, including trades that open, transfer or close exposure.
How do you calculate Hyperliquid open interest in dollars?
For an approximate notional value, multiply the asset-sized openInterest figure by the current mark price. Keep both inputs and the timestamp because price and OI can change independently.
Does Hyperliquid open interest count both longs and shorts?
It reflects matched outstanding contracts without double-counting both sides. Aggregate long exposure and aggregate short exposure are equal, but each matched contract is counted once for open interest.
Why is my Hyperliquid order rejected at the open-interest cap?
The market may have reached a risk cap, causing an order that would increase OI to be rejected. Check the exact order error and live cap status; a reduce-only order that lowers exposure is treated differently.
Do liquidations reduce Hyperliquid open interest?
They often reduce OI when positions are successfully closed, but new positions can open at the same time. Falling OI can support a liquidation interpretation, but it does not prove one without other data.
Can high open interest make a market risky?
High OI means more outstanding exposure, which can matter during a sharp move. Actual risk also depends on leverage, margin, position concentration, funding, oracle behavior and available order-book liquidity.
Sources
- Hyperliquid documentation - Perpetuals Info endpoint↗ external
- Hyperliquid documentation - Risks↗ external
- Hyperliquid documentation - HIP-3 deployer actions↗ external
- Hyperliquid documentation - Funding↗ external
- Hyperliquid documentation - Liquidations↗ external
- CME Group education - Open interest↗ external
- CFTC glossary - Open interest↗ external